Visualizing graphs
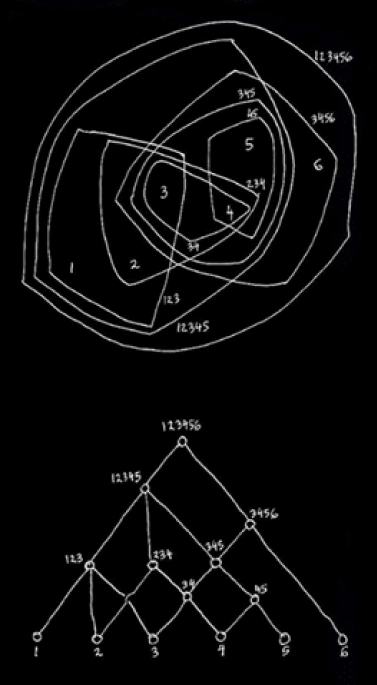
The example the article used was to try and an orange, a watermelon, a football and a tennis ball. How will you keep them in your mind, in your mind’s eye? However you do it, you will do it by grouping them. Maybe two fruits and two sports balls together. In doing so, you construct a tree structure. Maybe you group it by size, two small spheres and two large spheres. This constructs another tree. But try as hard as you like, two trees combined form a semilattice. It is very difficult to hold a semilattice in your head.
Maybe this is where tools like knowledge graphs come in. How might tools and visualizations allow us to better visually explore these graph relations and allow us to capture more complex relations in things?
- Regular note taking like Notion is hierarchical and linear: it’s a tree
- Graph and networked representations like Roam Research, Obsidian allow us to make non-obvious non-hierarchical connections between concepts
Algorithms
A join semi-lattice essentially is a topological sort or causal ordering of its elements except all of the elements can be joined (i.e. have a single shared ancestor)
See also: Order theory
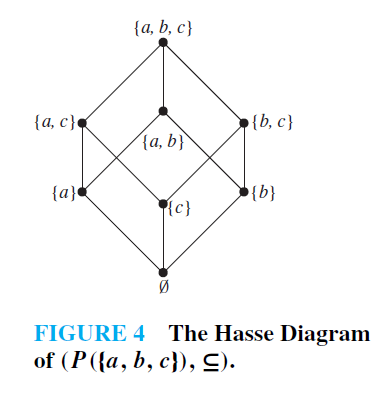
Hasse Diagram
We can illustrate the semi-lattice using a Hasse Diagram
Order theory
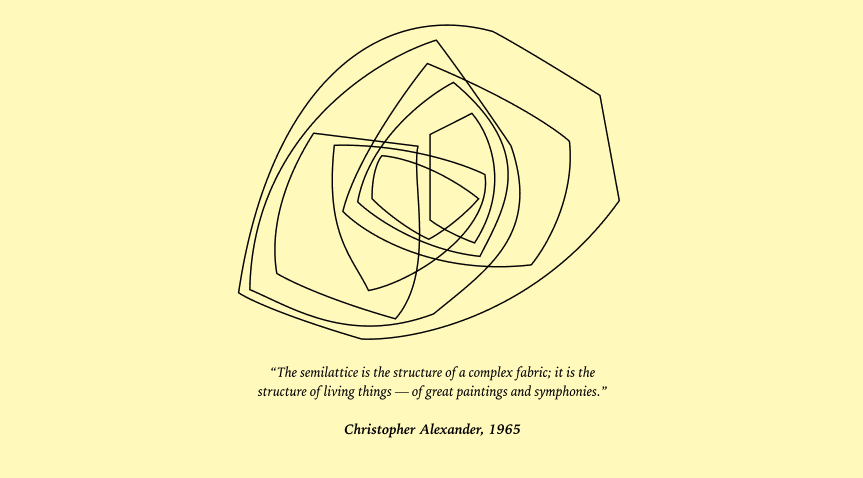
As the fabric of living things
See also: A City is not a Tree
 More diagrams in Figma